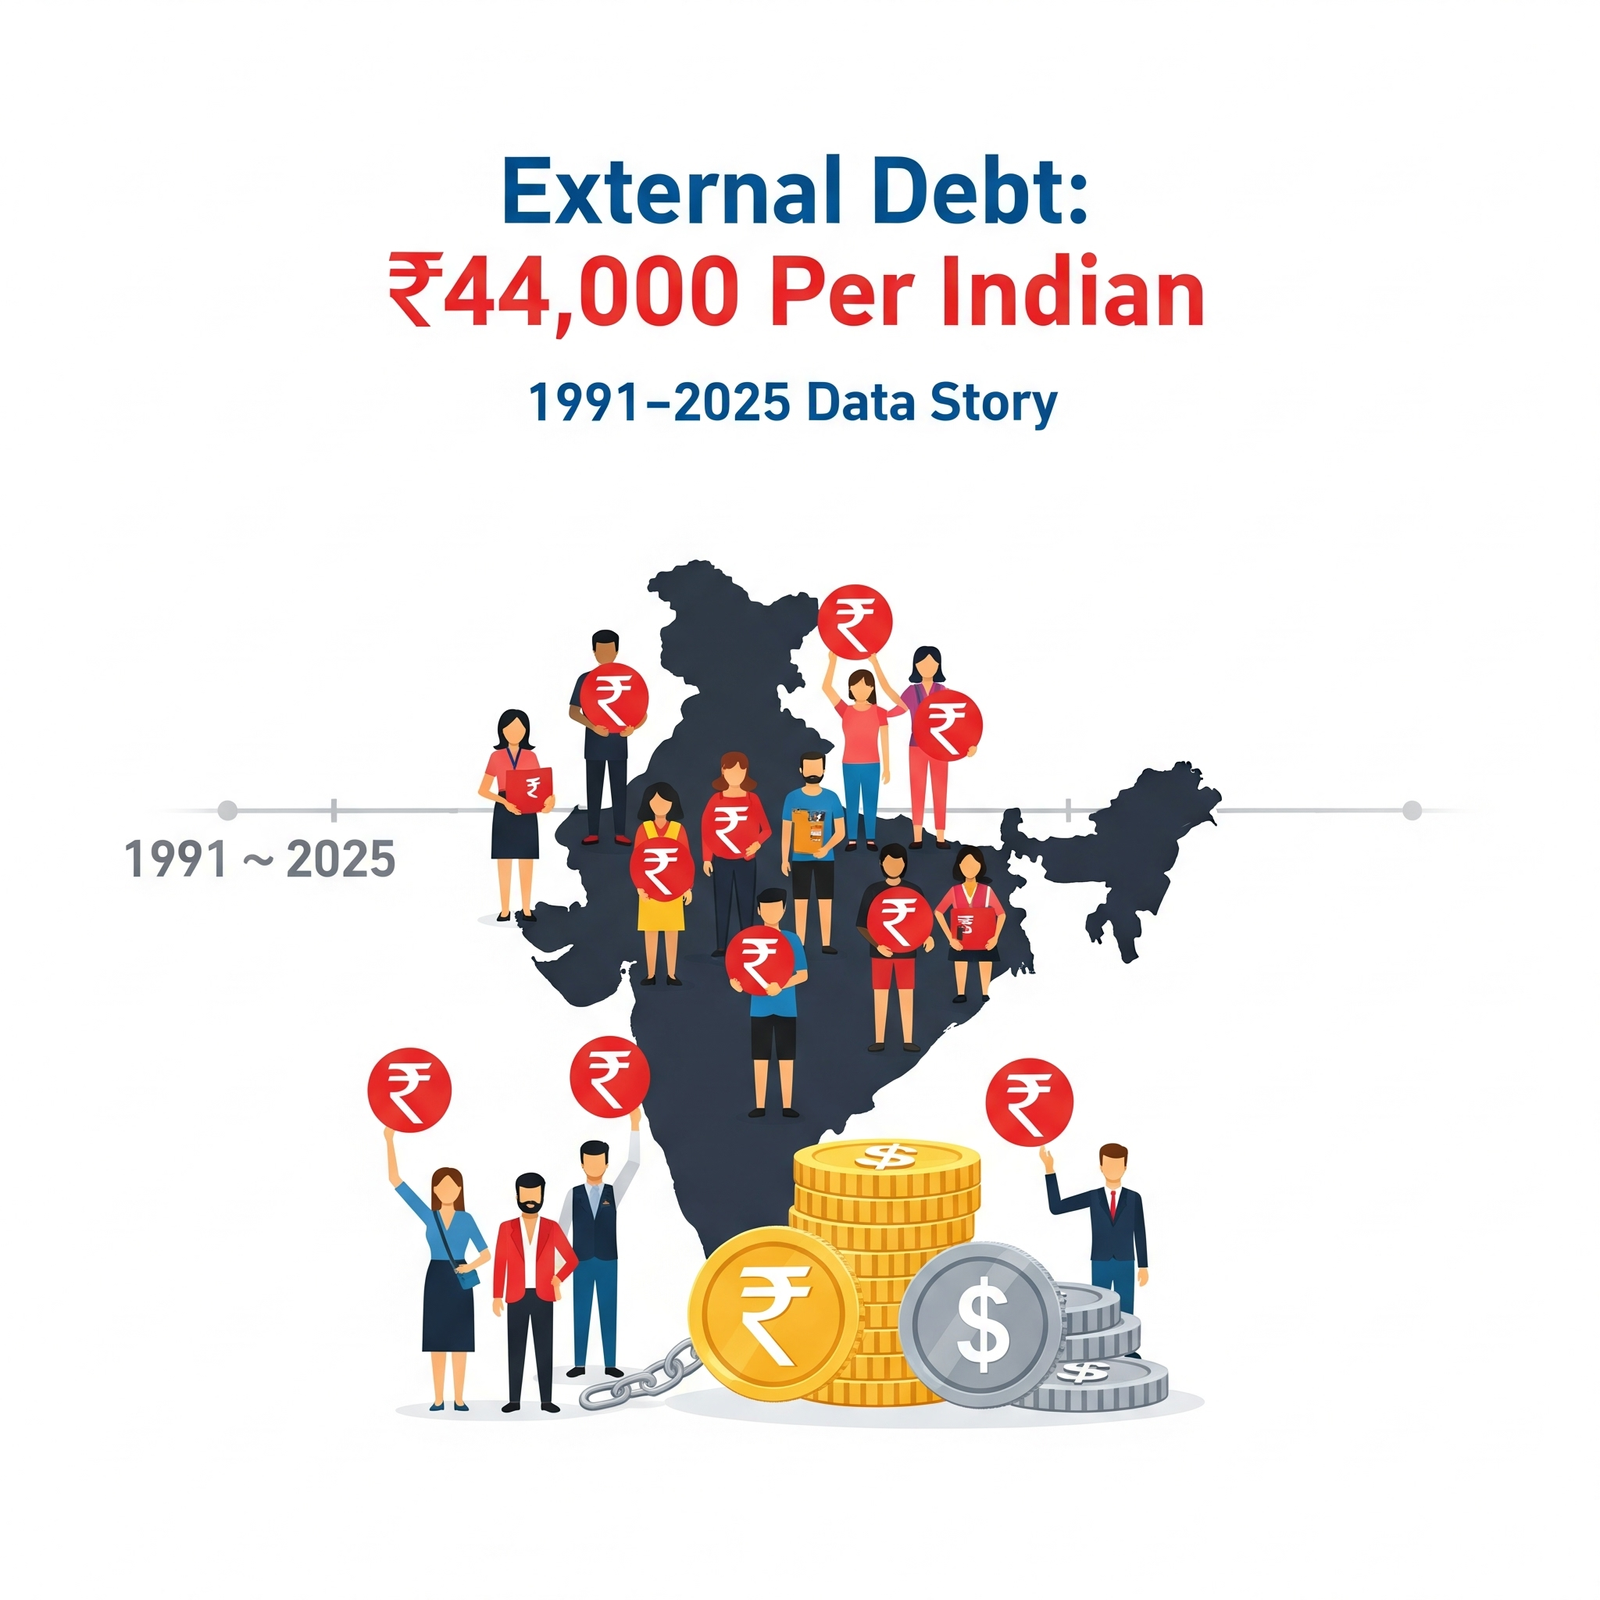
External Debt per Indian (1991–2025): How Much Do We Owe the World?
External debt rarely makes the headlines. GDP growth numbers, stock market rallies, or the rupee-dollar exchange rate often dominate public debate. Yet, behind the scenes, India has been steadily piling up obligations to the rest of the world.
At the end of March 2025, India’s external debt stood at ₹63,03,630 crore (USD 736 billion). That figure is difficult to grasp. But divide it by India’s population of ~1.43 billion, and suddenly it feels more personal: every Indian, on average, owes ₹44,000 (USD 515) to the world.
Why It Matters to You
- Because external debt influences the rupee-dollar exchange rate
- Influences prices of imports (fuel, gold, electronics)
- Impacts EMIs and borrowing costs when global rates rise
This isn’t debt you or I borrowed directly. It’s a national liability — money owed by the government, corporates, banks, and through deposits. But it affects us all. It influences the rupee’s strength, foreign investor confidence, and the resources available for growth.
So how did this debt build up over three decades? Who lent us the money? And how does India compare globally? Let’s dive deep.
India’s Debt Journey: 1991–2025
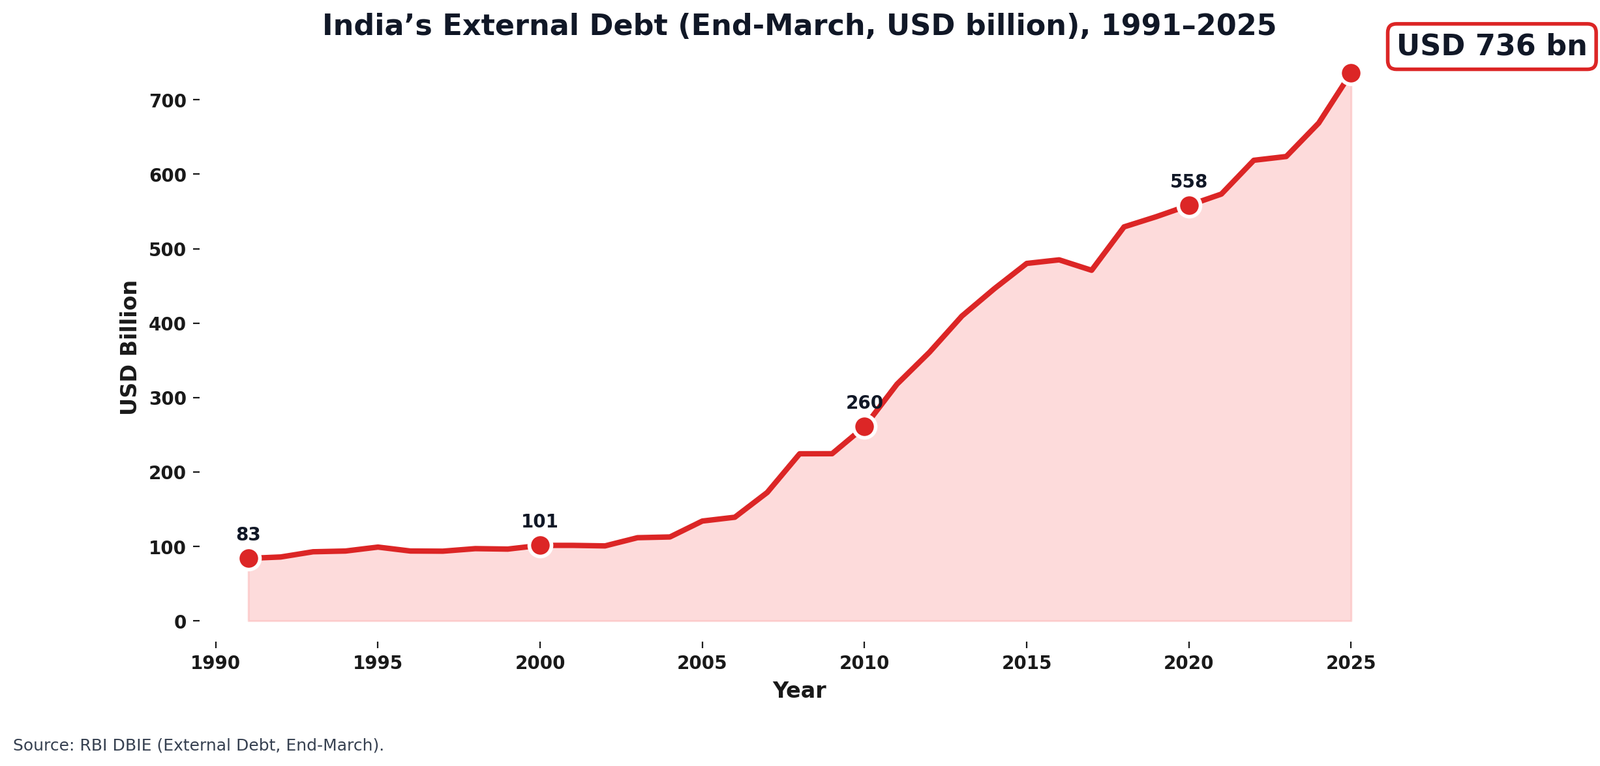
India’s external debt has grown nearly 39 times in rupee terms since 1991. But the story isn’t one of straight-line growth — it mirrors global crises, domestic reforms, and currency shifts.
India’s Gross External Debt (1991–2025)
(End-March position; ₹ crore and USD billion)
| Year | Debt (₹ crore) | Debt (USD bn) |
|---|---|---|
| 1991 | 163,001 | 83.8 |
| 1992 | 252,910 | 85.7 |
| 1993 | 280,746 | 92.7 |
| 1994 | 290,418 | 93.7 |
| 1995 | 311,685 | 99.0 |
| 1996 | 320,728 | 93.7 |
| 1997 | 335,827 | 93.5 |
| 1998 | 369,682 | 96.9 |
| 1999 | 411,297 | 96.3 |
| 2000 | 428,550 | 101.3 |
| 2001 | 472,625 | 101.3 |
| 2002 | 482,328 | 100.6 |
| 2003 | 498,804 | 111.6 |
| 2004 | 495,459 | 112.6 |
| 2005 | 586,305 | 134.0 |
| 2006 | 620,522 | 139.1 |
| 2007 | 751,402 | 172.4 |
| 2008 | 897,290 | 224.4 |
| 2009 | 1,142,125 | 224.5 |
| 2010 | 1,178,638 | 260.9 |
| 2011 | 1,419,407 | 317.9 |
| 2012 | 1,844,167 | 360.8 |
| 2013 | 2,224,734 | 409.4 |
| 2014 | 2,682,214 | 446.2 |
| 2015 | 2,971,542 | 480.2 |
| 2016 | 3,217,563 | 485.0 |
| 2017 | 3,055,095 | 471.0 |
| 2018 | 3,441,883 | 529.3 |
| 2019 | 3,755,028 | 543.1 |
| 2020 | 4,196,731 | 558.3 |
| 2021 | 4,190,490 | 573.4 |
| 2022 | 4,698,109 | 618.8 |
| 2023 | 5,129,944 | 623.9 |
| 2024 | 5,576,120 | 668.8 |
| 2025 | 6,303,630 | 736.3 |
1990s: Crisis & Reforms
In 1991, India pledged gold to raise loans. Debt was USD 84 bn, but reserves barely covered imports. Reforms opened the economy, keeping debt growth modest.
2000s: Globalization Boom
By 2008, debt rose to USD 224 bn — fuelled by NRI deposits and commercial borrowings. The 2008 crisis hit, but debt held steady near this level.
2010s: Volatile Times
Debt jumped past USD 400 bn in 2013 as the rupee weakened. The US Fed’s “taper tantrum” triggered outflows, pushed the rupee lower, and inflated India’s debt burden.
2020s: Pandemic Highs
COVID borrowing lifted debt to a record USD 736 bn by 2025. Reserves remain large, but their cover has slipped to 91%.
Debt Per Indian: A 35-Year Journey
Per-capita debt rose 20x since 1991, but totals rose nearly 40x — the burden per person grew far more moderately.
Table 2: Per Indian Debt Burden
| Year | Population (bn) | Debt (₹ crore) | Debt per Indian (₹) |
|---|---|---|---|
| 1991 | 0.846 | 163,001 | 1,927 |
| 2000 | 1.020 | 428,550 | 4,199 |
| 2010 | 1.210 | 1,178,638 | 9,740 |
| 2025 | 1.430 | 6,303,630 | 44,080 |
Sources:
For years like 2000 and 2010, values are estimated between census counts.
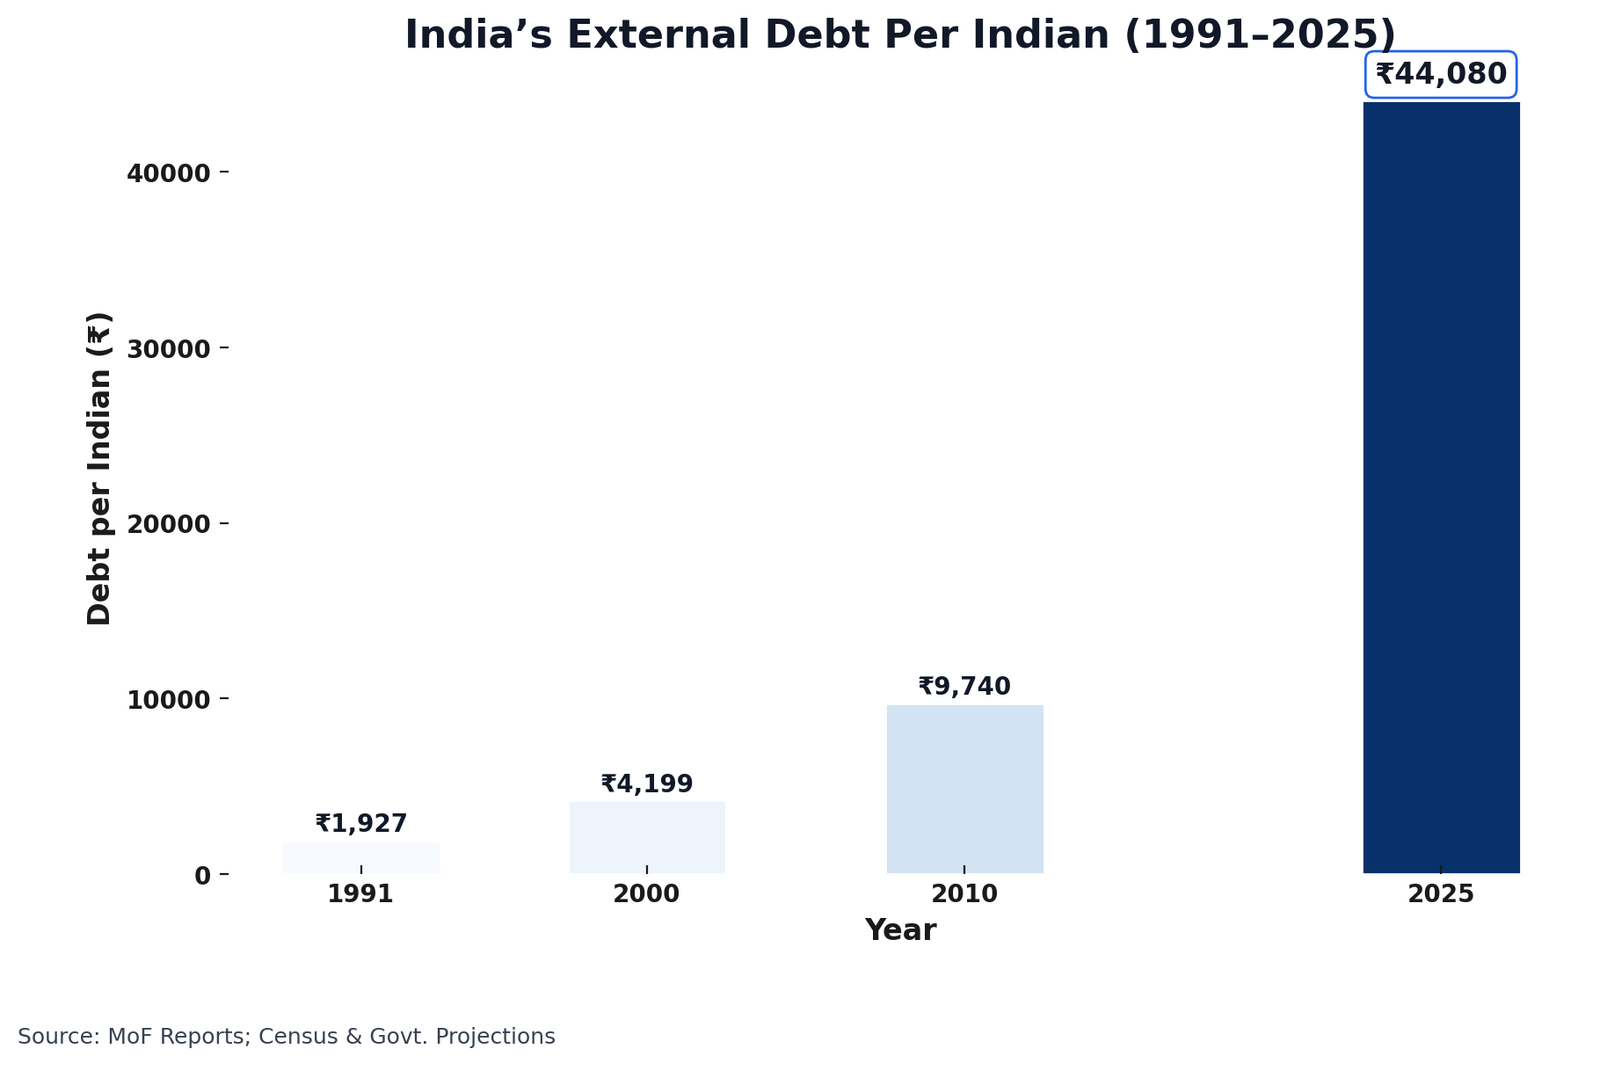
The numbers show a story: the economy and population both grew, so while debt totals rose, per-head burden grew more moderately.
Who We Owe: India’s Creditors
India’s debt story is not just about size, but also about structure. The maturity profile and debtor type reveal where risks really lie.
Debt by Original Maturity (March 2025)
- Long-term: USD 601.9 bn (81.7%)
- Short-term: USD 134.5 bn (18.3%)
- Most of India’s short-term debt is just trade credit — payments for imports and exports. The rest comes from bank account balances with foreign/Indian banks (Nostro/Vostro, ~2%) and a small slice of foreign investor money in Treasury Bills (~1%).
Original vs Residual Maturity: What’s the Difference?
- Original maturity = loan tenure at the time of borrowing (long-term vs short-term).
- Residual maturity = how much time is left before repayment today.
- India borrows mainly long-term, but as of March 2025, 41% of debt is coming due within a year.
Debt by Residual Maturity (March 2025)
| Residual Maturity | USD bn | Share of Total |
|---|---|---|
| Up to 1 year | 303.7 | 41.2% |
| 1–2 years | 79.3 | 10.8% |
| 2–3 years | 65.2 | 8.9% |
| More than 3 years | 288.1 | 39.1% |
| Total | 736.3 | 100% |
As explained earlier, Residual maturity means how soon the debt actually comes due, regardless of its original contract term.
- 41% (USD 304 bn) due within 1 year – high rollover pressure.
- 21% due in 1–3 years – medium-term obligations.
- 39% due after 3 years – provides stability.
Even though most of India’s debt was borrowed long-term, nearly two thirds will need refinancing or repayment before 2028 — making strong forex reserves critical.
Debt by Debtor Type (March 2025)
| Debtor Type | USD bn | Notes |
|---|---|---|
| Non-financial corporations (NFCs) | 261.7 | ~50% short-term trade credit; rest ECB & bonds |
| Deposit-taking corporations (Banks) | 202.1 | 98.6% long-term; NRI deposits = 164.7 |
| General Government | 168.4 | Mostly multilateral & bilateral loans (102.6) + FPI in G-Secs (43.6) |
| Other financial corporations (OFCs) | 69.2 | Fastest growth (+43% y-o-y) |
| Direct Investment (Inter-company) | 34.9 | Parent-subsidiary lending |
| Central Bank + NPISH | Negl. | Near zero |
| Total | 736.3 |
India’s External Debt by Creditor (March 2025)
| Cluster | Amount (USD bn) | Share of Total | Key Creditors / Notes |
|---|---|---|---|
| Sovereign (Govt. + Multilaterals + IMF) | 168.4 | 23% | ADB, World Bank, IMF, Japan, Russia, Germany, France |
| • Multilaterals | 80.5 | 11% | ADB 22.9, World Bank (IBRD + IDA), AIIB, etc. |
| • Bilateral (Countries) | 39.2 | 5% | Japan 23.3, plus Russia, Germany, France, US |
| • IMF SDR Allocation | 22.0 | 3% | IMF’s special drawing rights to India |
| • Rupee Debt | 0.8 | <1% | Russia (legacy rupee loans) |
| Non-Sovereign (Markets, NRIs, Corporates) | 567.9 | 77% | Global bondholders, banks, diaspora |
| • Commercial Borrowings | 291.6 | 40% | ECBs, international bonds, loans from foreign banks |
| • NRI Deposits | 164.7 | 22% | Deposits from Indian diaspora abroad like Gulf, US, UK |
| • Trade Credit (Long-Term) | 3.1 | <1% | Supplier’s credit (>1 year) |
| • Short-Term Debt (97% trade credit) | 134.5 | 18% | 97% short-term trade credit, 2% Nostro/Vostro, 1% FPI in T-bills |
| Total | 736.3 | 100% |
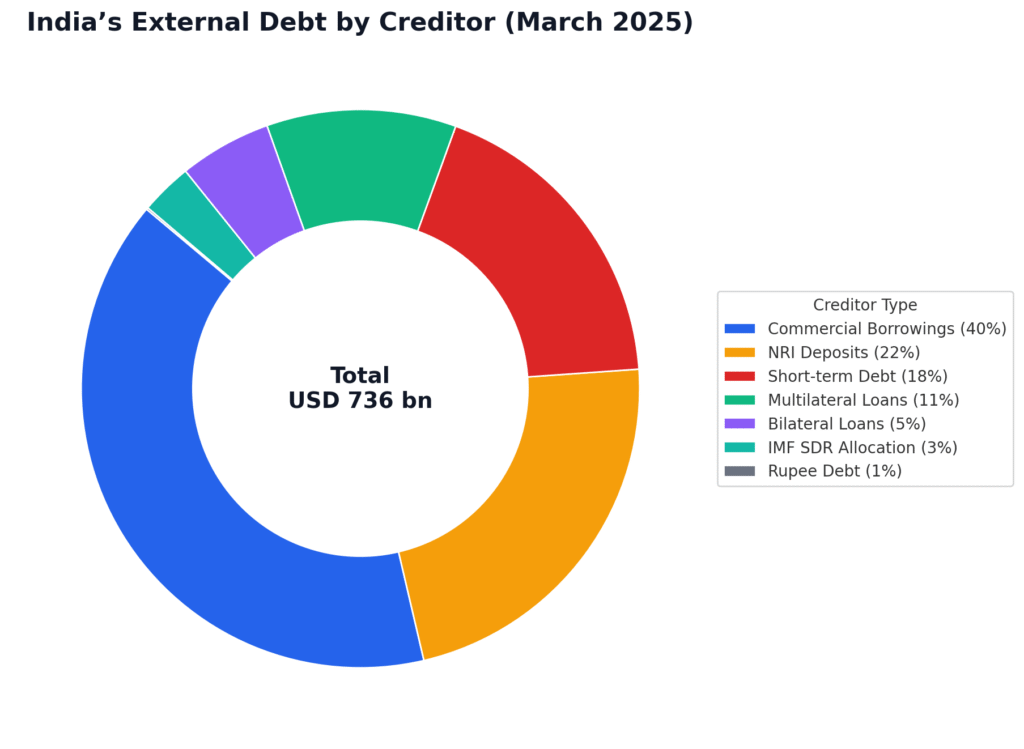
Insight: Japan is India’s largest bilateral lender (USD 23 bn), ADB + World Bank dominate multilateral loans, but nearly 77% of India’s external debt doesn’t come from governments at all — it comes from global markets, banks, and NRI deposits.
Quick Definitions
- Multilateral – Loans from global institutions like ADB, World Bank, IMF, AIIB.
- Bilateral – Loans from individual countries (e.g., Japan, Russia, Germany).
- IMF (SDR) – IMF allocates Special Drawing Rights as reserve assets; counts as India’s external liability.
- Rupee Debt – Old government-to-government debt, mostly owed to Russia, denominated in rupees.
- Commercial Borrowings – Loans raised by Indian corporates from abroad (bonds, external commercial borrowings, bank loans).
- NRI Deposits – Money Indian expatriates keep in Indian banks under NRE, NRO, FCNR(B) schemes.
- Trade Credit – Short-term credit from foreign suppliers for imports/exports.
- Short-Term Debt – Liabilities repayable within a year, including trade credit, foreign bank balances (Nostro/Vostro), and foreign investors in T-bills.
Why India Borrows: Purpose of External Debt
India’s external debt isn’t just about size or creditors — the purpose of these loans matters too.
- Government borrowings (multilaterals, bilaterals, IMF) → fund infrastructure, social sector, and defence projects, often at concessional rates.
- Commercial borrowings (ECBs, bonds, loans) → used by corporates for expansion, trade, and investment.
- NRI deposits → provide forex liquidity and stability.
- Trade credit → finance imports like oil, machinery, and electronics.
- Legacy rupee debt → mainly old defence loans from USSR.
This breakdown shows that most external debt supports development, trade, and corporate funding, not just government spending.
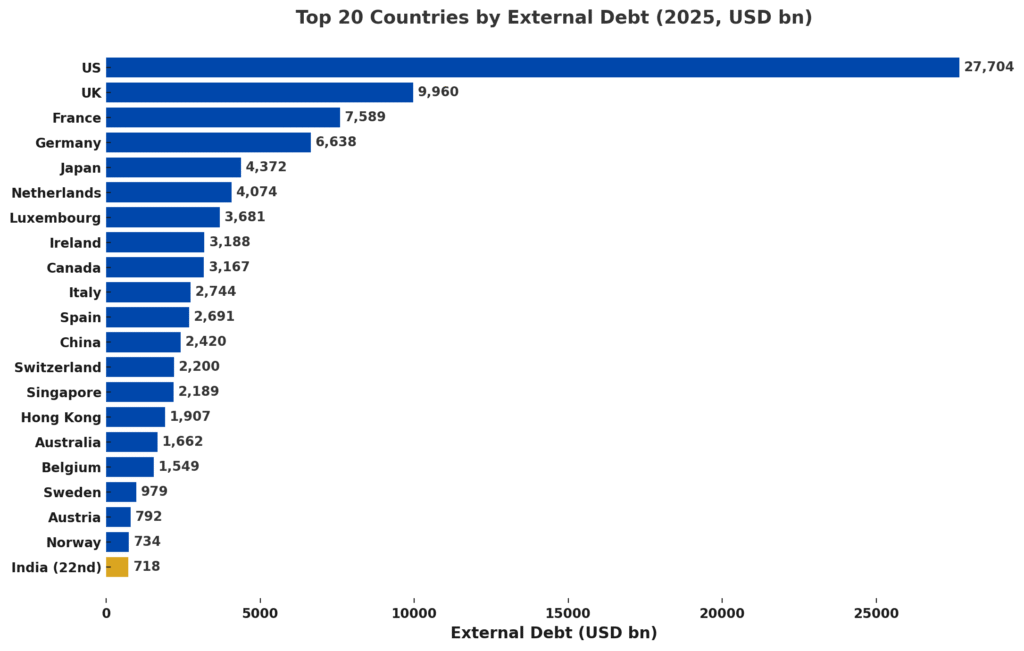
India vs The World
At end-2024, India ranked 22nd globally.
Top 20 Debtor Nations
| Rank | Country | Debt (USD bn) |
|---|---|---|
| 1 | US | 27,704 |
| 2 | UK | 9,960 |
| 3 | France | 7,589 |
| 4 | Germany | 6,638 |
| 5 | Japan | 4,372 |
| 6 | Netherlands | 4,074 |
| 7 | Luxembourg | 3,681 |
| 8 | Ireland | 3,188 |
| 9 | Canada | 3,167 |
| 10 | Italy | 2,744 |
| 11 | Spain | 2,691 |
| 12 | China | 2,420 |
| 13 | Switzerland | 2,200 |
| 14 | Singapore | 2,189 |
| 15 | Hong Kong | 1,907 |
| 16 | Australia | 1,662 |
| 17 | Belgium | 1,549 |
| 18 | Sweden | 979 |
| 19 | Austria | 792 |
| 20 | Norway | 734 |
| 22 | India | 718.5 |
Perspective:
- The US leads with USD 27.7 trillion — a reflection of its role as the world’s largest borrower and issuer of reserve currency.
- The UK, France, and Germany also dominate due to their deep financial markets.
- China’s USD 2.4 trillion debt is more than three times India’s, but its economy is also much larger.
- India’s per-capita debt is just USD 515 — tiny compared to the UK (~USD 100,000) or US (~USD 80,000).
Among emerging economies too, India fares better. Brazil’s debt-to-GDP ratio is ~38%, Turkey’s ~47%, versus India’s ~19%. This shows that while India borrows heavily in absolute numbers, relative to the size of its economy, it remains modest.
The Rupee Effect: Debt in INR vs USD
Why does India’s debt in rupees look so much bigger over time? Because the rupee weakened from ₹18/USD in 1991 to ₹85/USD in 2025.
So, the same USD 100 bn debt equals:
- ₹1.8 lakh crore in 1991
- ₹8.6 lakh crore in 2025
Thus, half the apparent “explosion” in rupee debt is due to the weaker rupee.
Read our deep dive on India vs Dollar for a broader picture of how the rupee compares with USD.
Risks Ahead
India’s debt position remains stable, but vulnerabilities are emerging:
- Shrinking reserve cover: India’s forex reserves now cover 91% of external debt in 2025, down from 97% in 2024, reducing the cushion against sudden capital outflows.
- Rising global interest rates: make refinancing external debt costlier, increasing repayment pressure.
- Persistent trade deficit: driven by oil, gold, and electronics imports, adds pressure on current account financing.
- High share of short-term debt: increases rollover risks in volatile markets, making India more sensitive to global liquidity conditions.
Why It’s Still Sustainable
- Debt-to-GDP stable around 19%.
- Sovereign share just 23%, keeping government exposure limited.
- Long-term borrowings dominate, reducing refinancing pressure.
- Forex reserves remain among the world’s strongest.
Future Outlook
India’s external debt will keep rising — as a growing economy, we will borrow to fund infrastructure, trade, and corporate expansion. But the key is balance:
- Maintain forex reserve cover above 80–90% to avoid vulnerability.
- Diversify imports to reduce dependence on oil and gold.
- Strengthen rupee internationalisation so borrowing risk in dollars is reduced.
- Encourage stable FDI inflows over volatile debt flows.
If India manages this balance, external debt will remain a tool for growth, not a crisis trigger.
Conclusion
India’s external debt looks big — ₹63 lakh crore, or about ₹44,000 per person. But big numbers don’t always mean big trouble.
- Debt has grown nearly 40x since 1991 in rupee terms (and ~9x in dollar terms), but India’s GDP has expanded even faster, keeping the burden manageable.
- The debt-to-GDP ratio remains far lower than advanced economies like the US or Japan.
- Forex reserves (~USD 650 bn) cover nearly 90% of India’s external debt, providing a strong buffer.
- On a per-capita basis, India’s external debt is just ~USD 515, modest compared to developed nations.
The real story isn’t the size of the debt, but its composition, maturity profile, and vulnerability to global shocks. India owes – but its economy has grown much stronger in carrying that debt.
Sources & Methodology
Primary Data Sources:
- Reserve Bank of India (RBI) – Database on Indian Economy (DBIE)
- Ministry of Finance (MoF) – India’s External Debt Reports
- Census of India – Population (1991, 2001, 2011) & official projections (2025)
Frequently Asked Questions (FAQs)
1. What is India’s external debt in 2025?
At the end of March 2025, India’s external debt stood at USD 736 billion (₹63 lakh crore).
2. How much external debt does each Indian owe?
On average, every Indian owes about ₹44,000 (USD 515) as part of the national external debt in 2025.
3. Who does India owe money to?
Around 77% of India’s external debt is owed to global markets, banks, and NRI deposits, while only 23% is owed to sovereign creditors like the World Bank, IMF, and Japan.
4. How does India’s external debt compare to other countries?
India ranks 22nd globally in absolute external debt. Per capita, India’s debt (~USD 515) is far lower than advanced economies like the US (~USD 80,000) or UK (~USD 100,000).
5. Is India’s external debt sustainable?
Yes. India’s debt-to-GDP ratio is ~19%, much lower than many developed and emerging economies. Strong forex reserves (91% cover) provide a buffer against risks.
6. Why does India’s external debt look so high in rupees?
Because the rupee has depreciated from ₹18/USD in 1991 to ₹85/USD in 2025. The same USD debt looks much larger in INR today.
7. What are the risks of India’s external debt?
Key risks include:
Shrinking reserve cover (down to 91% in 2025)
Rising global interest rates (costlier refinancing)
High short-term debt share (41% due within a year)
Persistent trade deficit (oil, gold, electronics imports).