
Institutional-grade data stories, research intelligence, and investment signals decoding India's economic transformation.
50+
Verified Datasets
50+
Intelligence Stories
10+
Economic Themes
Institutional
Grade Sources

Visual narratives that make India's economic complexity understandable.

Institutional-grade deep dives, sector intelligence, and strategic analysis.
Emerging opportunities, trend shifts, and macro indicators you can act on.

Interactive economic engines built on verified official data.
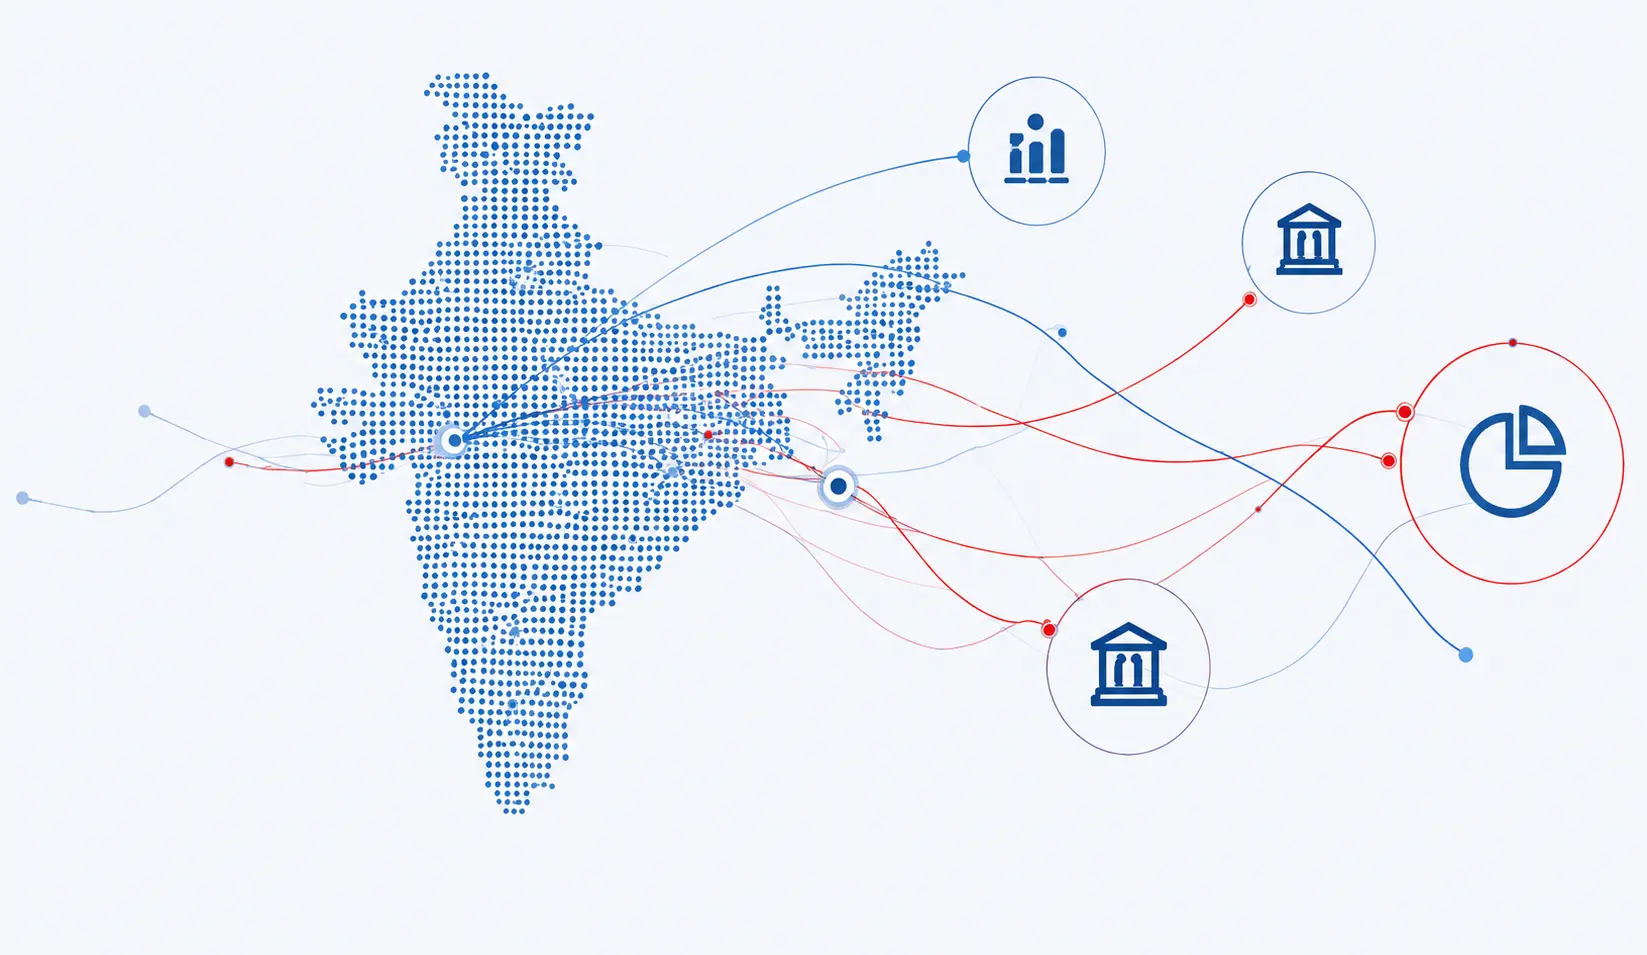
India generates vast economic data every day but much of it remains fragmented, inaccessible, or difficult to interpret.
IndiaGraphs transforms that complexity into structured intelligence for professionals who need clarity, not clutter.
High-quality, structured datasets and API access for seamless integration.
Actionable insights and advisory support for critical business and investment decisions.
Partner with IndiaGraphs for exclusive research and data solutions.


Whether you are running a desk, a fund, a startup, or a research project IndiaGraphs helps you plug into India's data with less friction.