India’s Household Savings 2025: 10 RBI Insights That Show How We Save, Spend & Borrow
On 28th August 2025, the Reserve Bank of India (RBI) released its Handbook of Statistics on the Indian Economy 2025— a comprehensive dataset capturing how Indian households save, borrow, and invest.
The latest numbers highlight important shifts: households remain the backbone of India’s savings, but liabilities are rising sharply; gold continues to play a significant role in portfolios; and financial savings as a share of GDP have halved within just a few years.
This Indiagraphs analysis distills 10 key insights from RBI’s latest release, presenting the data through concise commentary, structured tables, and visual charts to show how India’s financial behaviour is evolving.
Source: RBI, Handbook of Statistics on the Indian Economy 2025
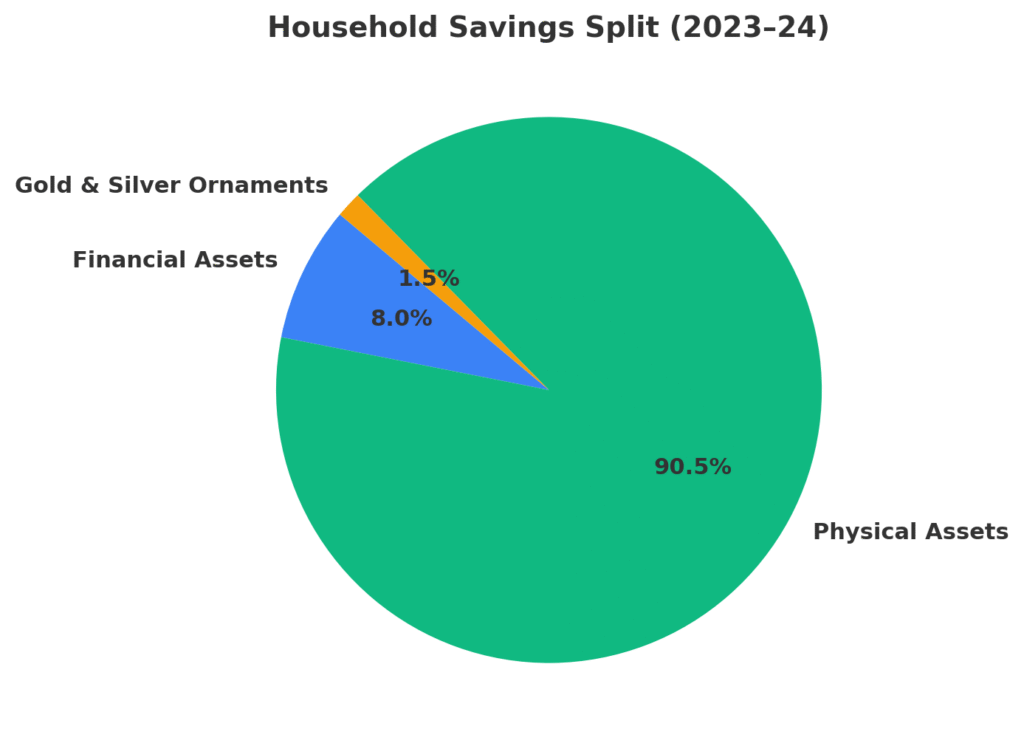
1. India’s Households Are Still the Nation’s Biggest Savers
- In 2023–24, households saved ₹54.6 lakh crore — over half of India’s total savings pool.
- This includes ₹38.4 lakh crore in physical assets (like real estate) and ₹3.4 lakh crore in financial assets (like deposits, insurance, PF).
Household Savings Split (2023–24)
| Category | Amount (₹ crore) | Share (%) |
| Financial Assets | 3,40,000 | 6% |
| Physical Assets | 38,40,000 | 70% |
| Gold & Silver Ornaments | 65,000 | 1% |
| Liabilities (net) | 18,80,000 | 23% |
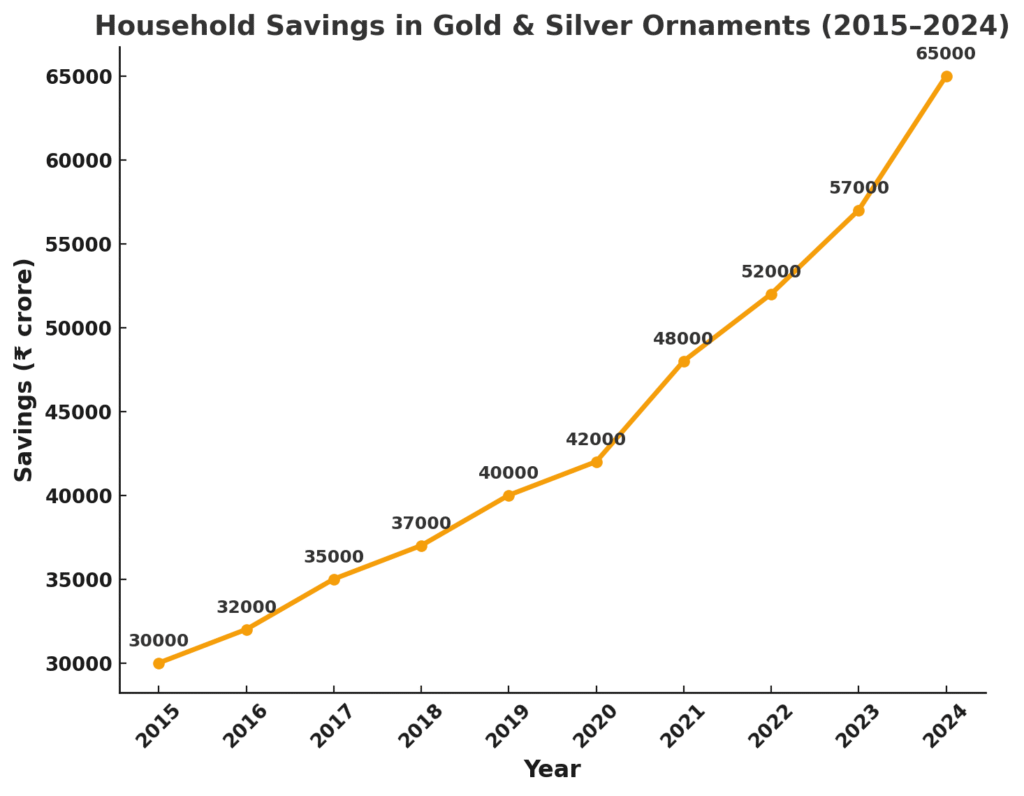
2. Gold Still Shines in Indian Portfolios
- Despite fintech apps and SIP culture, Indians saved ₹65,000 crore in gold & silver ornaments in 2023–24 — almost the same as FY 2022–23.
- The love for gold remains unshaken, making India one of the world’s top bullion consumers.
Household Savings in Gold & Silver (₹ crore)
| Year | Gold & Silver Ornaments |
| 2020 | 42,000 |
| 2021 | 48,000 |
| 2022 | 52,000 |
| 2023 | 62,000 |
| 2024 | 65,000 |
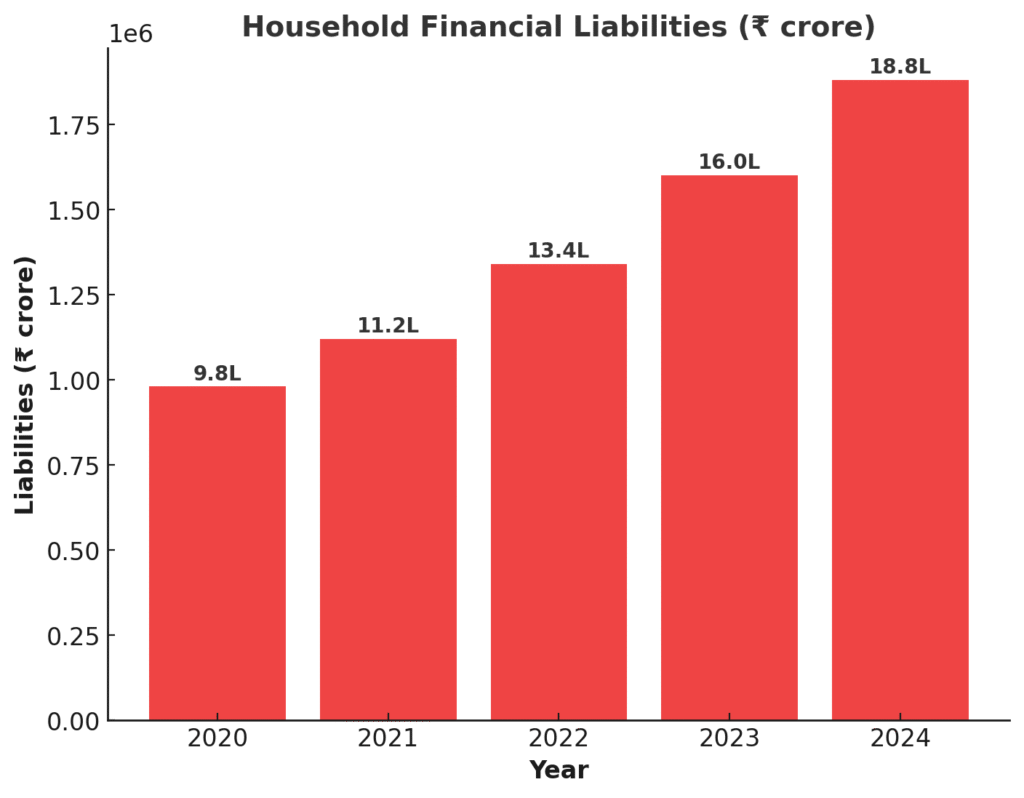
3. Financial Liabilities Are Catching Up
- Household financial liabilities surged to ₹18.8 lakh crore in 2023–24, nearly doubling from two years ago.
- Rising personal loans, housing finance, and credit card dues are reshaping India’s debt profile.
Household Liabilities (₹ crore)
| Year | Liabilities |
| 2020 | 9,80,000 |
| 2021 | 11,20,000 |
| 2022 | 13,40,000 |
| 2023 | 16,00,000 |
| 2024 | 18,80,000 |
4. Bank Deposits Remain King
- Of all financial assets, bank deposits grew fastest, reaching ₹14.4 lakh crore in 2023–24.
- This shows the trust in banks despite booming UPI and fintech-led wallets.
Household Financial Assets – Deposits (₹ crore)
| Year | Deposits |
| 2020 | 9,20,000 |
| 2021 | 10,70,000 |
| 2022 | 12,60,000 |
| 2023 | 13,50,000 |
| 2024 | 14,40,000 |
5. Insurance & Pension Are the Quiet Winners
Life insurance funds and provident/pension funds together crossed ₹13 lakh crore in 2023–24, showing a rising appetite for long-term safety nets.
Household Financial Assets – Insurance & Pension (₹ crore)
| Year | Insurance Funds | PF & Pension Funds |
| 2020 | 4,20,000 | 3,80,000 |
| 2021 | 4,60,000 | 4,20,000 |
| 2022 | 5,00,000 | 4,80,000 |
| 2023 | 5,40,000 | 5,60,000 |
| 2024 | 5,80,000 | 7,20,000 |
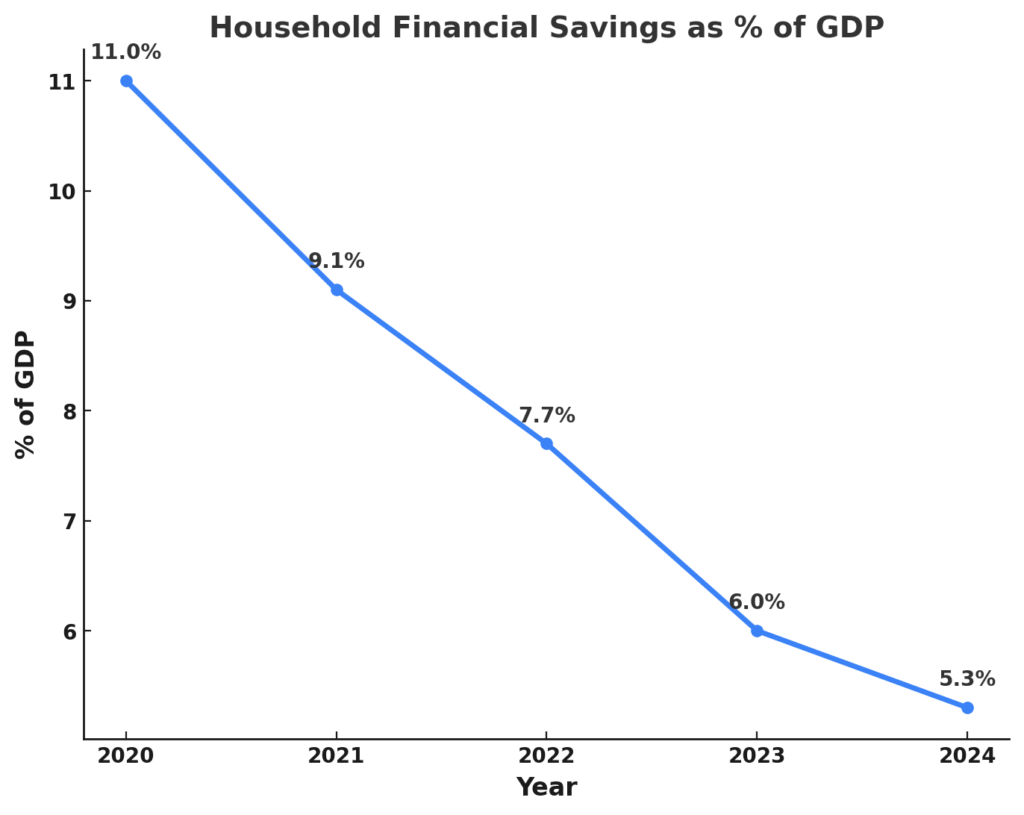
6. Household Savings to GDP — A Sharp Slide
- Household gross financial savings were 11% of GDP in FY 2020–21, but dropped to 5.3% in 2023–24.
- This sharp fall is a red flag for policymakers tracking financial stability.
Household Financial Savings as % of GDP
| Year | % of GDP |
| 2020 | 11.0% |
| 2021 | 9.1% |
| 2022 | 7.7% |
| 2023 | 6.0% |
| 2024 | 5.3% |
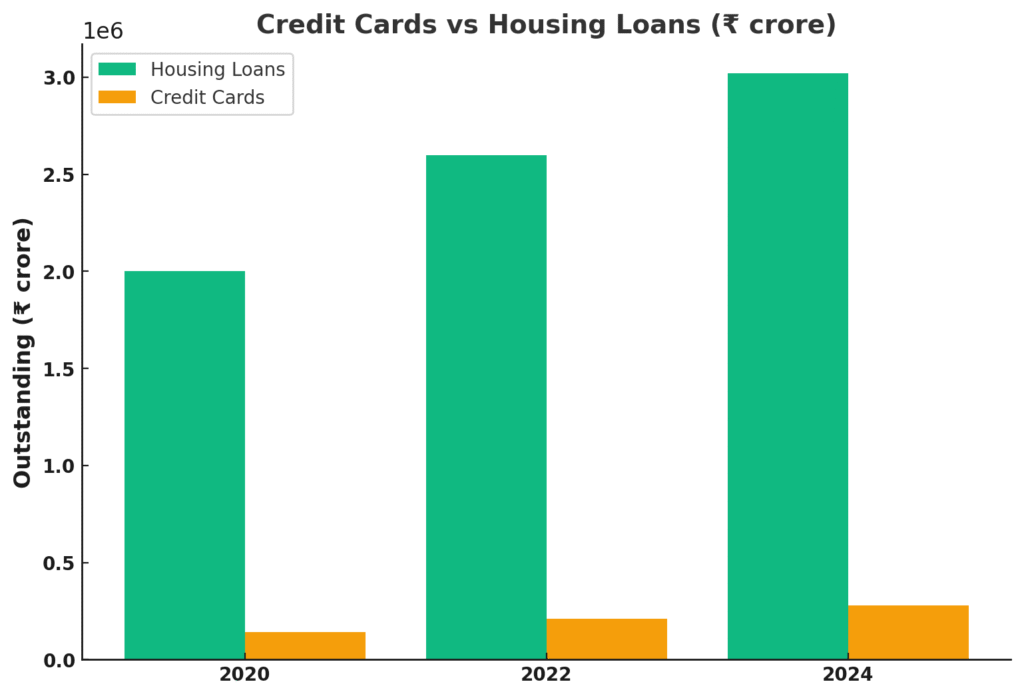
7. Credit Card & Personal Loans on Fire
- Credit card outstanding doubled in 5 years, hitting ₹2.8 lakh crore in FY 2023–24.
- Personal loans (housing, education, vehicles) touched ₹59.5 lakh crore, led by housing loans crossing ₹30 lakh crore.
Household Borrowings by Loan Type (₹ crore)
| Year | Housing Loans | Vehicle Loans | Credit Cards | Education Loans |
| 2020 | 20,00,000 | 4,50,000 | 1,40,000 | 80,000 |
| 2022 | 26,00,000 | 5,40,000 | 2,10,000 | 85,000 |
| 2024 | 30,20,000 | 6,00,000 | 2,80,000 | 90,000 |
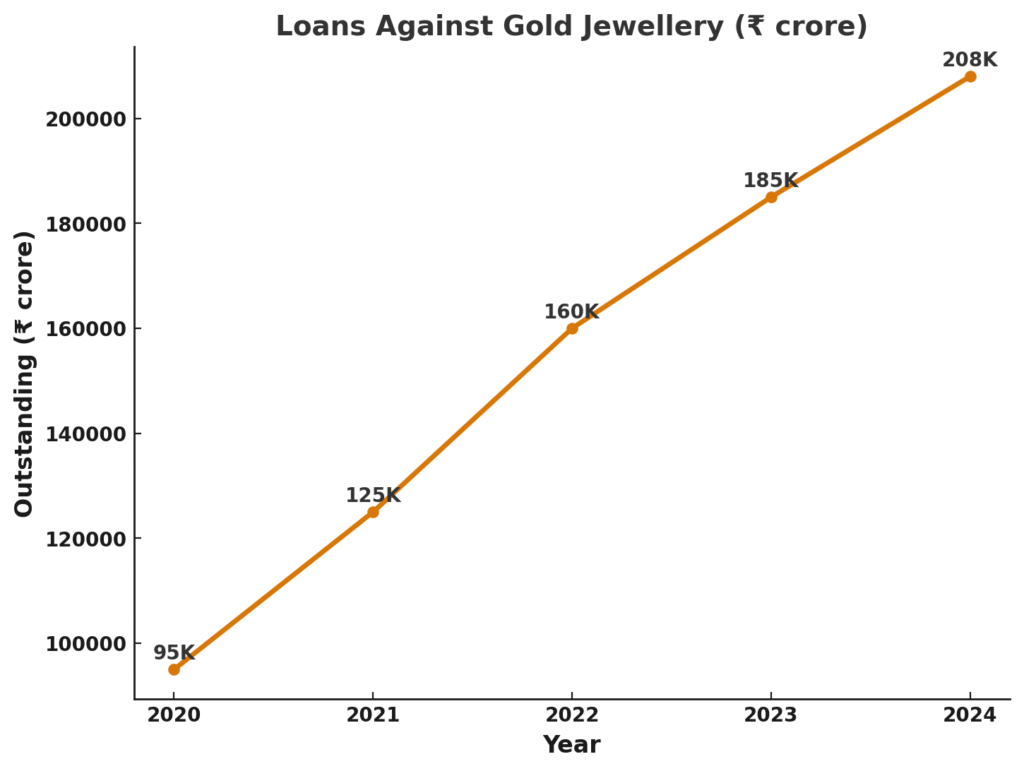
8. Gold Loans Boom
- Loans against gold jewelry surged 2x in just two years, touching ₹2.08 lakh crore in 2023–24.
- Proof that households still use gold as collateral during cash crunches.
Loans Against Gold (₹ crore)
| Year | Gold Loan Outstanding |
| 2020 | 95,000 |
| 2021 | 1,25,000 |
| 2022 | 1,60,000 |
| 2023 | 1,85,000 |
| 2024 | 2,08,000 |
9. Small Savings Schemes Still Matter
- Post Office savings, PPF, NSC, and Sukanya Samriddhi accounts together held over ₹12 lakh crore in FY 2024, a vital cushion for middle-class families.
Small Savings Schemes (₹ crore)
| Year | PPF | NSC | Sukanya | Post Office Deposits | Total |
| 2020 | 2,50,000 | 1,80,000 | 40,000 | 6,20,000 | 10,90,000 |
| 2022 | 2,90,000 | 2,00,000 | 60,000 | 6,80,000 | 12,30,000 |
| 2024 | 3,40,000 | 2,20,000 | 80,000 | 7,60,000 | 12,00,000+ |
10. India’s Savings Culture Is Transforming
- From “physical-first” (homes, gold) to “digital & financial-first” (SIPs, insurance, pensions), the shift is underway.Yet, the DNA of Indian savings remains cautious, balancing between safety and aspiration.
Conclusion
In just over a decade, India’s household balance sheet has transformed. While physical assets still dominate savings, financial liabilities have nearly doubled in two years, deposits remain the largest financial asset, and gold continues to hold its timeless allure. At the same time, household financial savings as a share of GDP have halved from 11% in 2020–21 to just 5.3% in 2023–24.
This means Indian households are no longer just passive savers. They are borrowing more, investing more, and diversifying — reshaping the very foundations of India’s financial system.
Planning to buy a house? Use our Home Loan Calculator to check EMI, interest, and repayment impact on your savings.


Great insights! Loved how you broke down the RBI data — it really shows the changing habits in how Indian households save, spend, and borrow. Looking forward to more posts like this!