India’s Renewable Energy in 2025: Capacity, Challenges, and Net Zero Progress
India’s clean energy journey is gaining serious momentum. In 2025, the country finds itself at a powerful crossroads — trying to balance booming energy demand, energy security, and climate responsibility. In this article we will take a deep, data-backed look at where India stands today, what’s working, what’s not, and how far we still have to go.
Key Metrics (2025)
| Metric | Value |
| Total Installed Power Capacity (All Sources) | ~485 GW (as of June 2025) |
| Installed Renewable Capacity | ~234GW (48.27% share) |
| Target by 2030 | 500 GW non-fossil fuel based |
| Total Generation (All Sources) | ~159 BU (as of May 2025) |
| RE Share in Total Generation | ~25% (in May 2025) |
Unit Clarification:
- 1 GW (Gigawatt) = 1,000 MW (Megawatt) = 1,000,000 kW (Kilowatt)
- 1 MW of capacity can power ~1,000 Indian homes annually, depending on usage and availability.
- Therefore, 1 GW can power ~7–10 lakh Indian homes, depending on location, load factor, and energy source (solar/wind vs thermal). 1 lakh = 100,000.
When used in energy discussions, GW usually refers to the maximum power a plant can generate at full capacity (installed capacity).
- Installed Capacity = The plant’s potential
- Generation Output (TWh) = Actual electricity generated over time
Installed Capacity vs Generation Output — Explained Simply
Installed Capacity (Measured in GW)
This is the maximum power a source can produce at a given point — like a car’s top speed.
- If a power plant is rated at 1 GW, it means it can deliver 1 gigawatt of power at any given moment when running at full load. Over time, the total energy it generates depends on how long it operates.
- India’s coal installed capacity in June 2025 is ~215 GW, which means if all coal plants ran at full power, they’d produce 215 GW at that moment.
Installed Capacity = Potential
Generation Output (Measured in TWh or MU)
This refers to how much electricity was actually produced over a period of time — like tracking how many kilometers a car drives in a year, not just how powerful the engine is.
- A plant may be 1 GW in capacity, but if it only runs for 12 hours/day or has fuel shortages, it won’t generate at full potential.
- Actual generation depends on how often and how efficiently the plant runs.
That’s why total generation, not just capacity — is what really matters when measuring impact.
Generation = Actual performance
Unit Clarification:
This table explains the common electricity generation and consumption units used in India and globally.
| Unit | Equivalent | Usage |
|---|---|---|
| kWh (Kilowatt-hour) | Basic unit of electricity | Used for household billing |
| MU (Million Units) | 1 MU = 1 million kWh = 1 GWh | Used in India for state-level or plant-level reporting |
| BU (Billion Units) | 1 BU = 1,000 MU = 1 billion kWh = 1 TWh | Common in media and national-level summaries |
| TWh (Terawatt-hour) | 1 TWh = 1 billion kWh = 1,000 MU = 1 BU | Standard for global comparisons and long-term trends |
1 MU can power ~1,000 Indian homes for a year.
1 TWh can power ~10 lakh Indian homes for a year.
India’s Total Installed Power Capacity (June 2025):
| Source | Capacity (GW) | Share of Total (%) |
|---|---|---|
| Thermal (Total) | 242 | 49.92% |
| – Coal | 215 | 44.33% |
| – Lignite | 7 | 1.44% |
| – Gas | 20 | 4.12% |
| – Diesel | 1 | 0.21% |
| Renewables (Total) | 234 | 48.27% |
| – Solar | 116 | 23.92% |
| – Wind | 52 | 10.72% |
| – Small Hydro | 5 | 1.03% |
| – Biomass + Others | 12 | 2.47% |
| – Large Hydro | 49 | 10.10% |
| Nuclear | 9 | 1.81% |
| Total | 485 | 100.00% |
Source: Central Electricity Authority
Generation Output (May 2025)
| Source | Generation (BU) | Share (%) |
|---|---|---|
| Thermal (Total) | 114 | 71.71% |
| – Coal | 109 | 68.55% |
| – Lignite | 2 | 1.26% |
| – Gas | 3 | 1.89% |
| – Diesel | 0 | 0.02% |
| Renewables (Total) | 40 | 25.16% |
| – Solar | 14 | 8.81% |
| – Wind | 11 | 6.92% |
| – Small Hydro | 1 | 0.63% |
| – Biomass + Others | 1 | 0.63% |
| – Large Hydro | 13 | 8.18% |
| Nuclear | 5 | 3.14% |
| Total | 159 | 100.00% |
1 Billion Unit (BU) of electricity can power around 10 lakh homes. In May 2025, India generated ~160 BU per month — enough to cover a large share of residential demand, though a significant part also supports industries and agriculture.
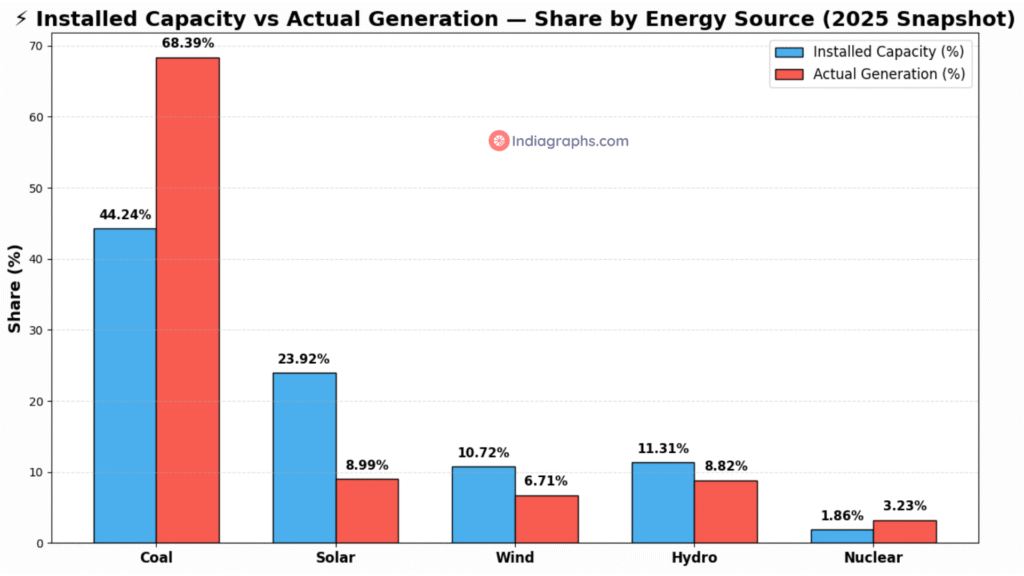
Why Coal Generates More Than Renewables
Here’s the interesting part:
As shown in the table below, renewables (with large hydro included) now account for 48% of India’s total installed capacity — but contribute just 24.52% to actual generation.
| Source | Installed Capacity (as of June 2025) | Share of Generation (May 2025, out of 159 BU) | Why the Difference? |
| Coal | 215 GW (44.24%) | 108.84 BU (68.39%) | Runs almost 24×7, not weather-dependent |
| Solar | 116 GW (23.92%) | 14.31 BU (8.99%) | Only generates when the sun shines |
| Wind | 52 GW (10.72%) | 10.67 BU (6.71%) | Only runs when there’s wind |
| Hydro | 54 GW (11.31%) | 14.04 BU (8.82%) | Seasonal — affected by monsoon |
| Nuclear | 9 GW (1.86%) | 5.14 BU (3.23%) | Limited capacity, high efficiency |
Example:
Let’s say:
- You install a 1 GW solar plant
- But the sun only shines 6 hours/day
- So daily generation = 1 GW × 6 hours = 6 GWh/day = 0.006 BU/day
- But a coal plant running at full capacity for 24 hours a day would generate:
1 GW × 24 hours = 24 GWh/day = 0.024 BU/day
(GWh = Gigawatt-hours, a measure of energy produced over time)
That’s why coal gives 3–4x more electricity than solar per GW installed.
Real-world Analogy:
- A coal power plant may run 70–80% of the time because it’s not dependent on weather.
- A solar plant might run only 20–25% of the time (sunlight hours).
While fossil fuels and non-fossil sources now contribute almost equally to India’s installed capacity, fossil fuels still dominate electricity generation — producing nearly 72% of the total power
| Metric | Fossil Fuels | Non-Fossil Fuels |
|---|---|---|
| Installed Capacity (GW) | 242 (49.9%) | 243 (50.1%) |
| Power Generation (BU) | 114 (71.7%) | 45 (28.3%) |
Insight: Renewable capacity is rising, but actual power generation still heavily relies on coal due to higher load factors of thermal plants and intermittency in solar/wind.
India’s Renewable Energy Targets
| Target Year | Goal | Achievement | Status |
| 2022 | 175 GW Renewables (100 GW Solar, 60 GW Wind, 10 GW Bio, 5 GW Small Hydro) | ~121 GW installed:• 63 GW Solar• 42 GW Wind• 10 GW Bio• 5 GW Hydro | Partially Met |
| 2030 | 500 GW Non-Fossil Fuels (incl. Nuclear, Hydro, Solar, Wind, Bio) | ~243 GW non-fossil as of June 2025 (Renewables including Large Hydro + Nuclear) | Work in Progress |
| 2070 | Net Zero Carbon Emissions | Long-term decarbonization underway; India is balancing development & climate commitments | On Long-Term Pathway |
India’s 2030 goal includes solar, wind, hydro, nuclear, biomass and green hydrogen.
What is Net Zero?
Net Zero means that a country balances the greenhouse gases it emits with those it removes from the atmosphere — ideally reducing emissions as much as possible and absorbing the rest (e.g., via forests or carbon capture technologies).
Solar vs Wind
| Metric | Solar | Wind |
| Installed (June 2025) | 116 GW | 52 GW |
| Growth Trend | Rapid | Slower |
| Key States | Rajasthan, Gujarat, TN | TN, Gujarat, Karnataka |
| Challenges | Land, Storage | Location, Grid |
Key Challenges in Scaling Renewable Energy in India
1. Grid Integration
Challenge: Solar and wind energy are intermittent — they depend on sunlight and wind speed, which vary by time of day and season.
- This makes it hard for the national power grid to stay balanced — too much power when it’s sunny, and too little at night or during low wind.
- India’s power grid was designed around predictable coal power, so integrating variable sources without blackouts requires smart grids, forecasting systems, and real-time demand management.
2. Storage Limitations
Challenge: Without reliable storage, unused solar/wind power goes to waste.
- Battery storage (like lithium-ion) is still expensive and being deployed slowly.
- Pumped hydro storage (where water is pumped uphill when there’s extra energy and released later) exists, but only in a few locations.
- Until storage becomes cheaper and widespread, India can’t fully rely on renewables — because there’s no way to store daytime solar for night use.
India’s total energy storage capacity is just a fraction of what’s needed to balance large-scale renewables.
3. Land Acquisition
Challenge: Renewable energy, especially solar and wind, is land-hungry.
- 1 megawatt (MW) of solar typically requires 4–5 acres of land.
- Projects often face delays due to legal disputes, local resistance, or environmental concerns.
- In some regions, land is fragmented, disputed, or ecologically sensitive, making acquisition difficult and time-consuming.
Wind-rich areas (like Gujarat or Tamil Nadu) and sun-rich zones (like Rajasthan) often overlap with agriculture or tribal land, leading to delays.
4. Financing Hurdles
Challenge: Even with global interest, large-scale renewable projects need huge capital and long payback periods.
- Banks are still cautious due to uncertain cash flows, policy risks, and DISCOM (power distribution company) payment delays.
- Smaller developers struggle to get loans or favorable terms.
- International investors demand policy stability and ROI clarity, which varies from state to state.
A ₹500 crore solar park can take 5–7 years to break even, making it risky unless tariffs, policies, and payments are stable.
5. Policy & Clearances
Challenge: Energy is a concurrent subject — meaning both states and the central government share responsibility.
- This leads to red tape, delays, and inconsistent policies across states.
- Environmental clearances, grid permissions, and land approvals are multi-agency, multi-level processes.
- Even when central policies are aggressive (like 500 GW of non fossil fuel by 2030), state-level bottlenecks slow things down.
Example: A solar project approved by the central agency may still need months of clearance from state electricity boards.
India is rapidly expanding renewable energy — but scaling beyond 30–40% in the energy mix requires solving core infrastructure, financial, and governance issues.
Solutions like smart grids, national storage missions, clearer land laws, and easier financing frameworks are critical for the 2070 Net Zero goal.
How India is Tackling Renewable Energy Challenges
Despite the hurdles, India has launched a multi-pronged strategy to overcome its renewable energy roadblocks. Here’s how:
| Strategy | Current Status & Explanation |
| 1. Green Hydrogen Mission | – ₹19,744 crore allocated in 2023 under the National Green Hydrogen Mission to make India a global hub for green hydrogen production. – Goal: Produce 5 million tonnes annually by 2030 and cut fossil fuel imports. – Investments are flowing into electrolyzer manufacturing and hydrogen-powered mobility. Source: Business Standard |
| 2. PLI Scheme for Solar | – ₹24,000 crore Production-Linked Incentive (PLI) scheme launched for solar PV modules. – Focus: Create 65+ GW/year of domestic solar panel and cell manufacturing by 2026. – Reduces reliance on Chinese imports and makes India an export-capable solar hub. Source: MNRE, PIB |
| 3. Battery Storage Push | – Government has approved Viability Gap Funding (VGF) of ₹3,760 crore for 4,000 MWh of battery storage. – Also planning National Storage Mission to incentivize giga-scale battery projects. – Goal: Enable round-the-clock renewable supply by combining solar with storage. Source: PIB – Battery Storage VGF and National Storage Mission |
| 4. Green Energy Corridors | – India has built over 10,000+ km of dedicated transmission lines under Phase I of the Green Energy Corridors project. – Phase II is expanding RE grid connectivity in 7 more states. – Helps in transmitting wind and solar from remote areas (like Rajasthan/Gujarat) to demand centers. Source: PIB, Ministry of Power |
Additional Reforms & Steps Worth Mentioning
| Initiative | Details |
| Time-of-Day Tariffs (ToD) | Introduced in 2024 to incentivize use of solar during peak hours and discourage night-time consumption. Source: PIB |
| Carbon Market | India launched a voluntary carbon credit market for industries to trade emissions, boosting green investment. Source: PIB |
| Floating Solar & Agri-Solar | Solar panels on reservoirs and canals (floating) + solar over farmland (agrivoltaics) to reduce land pressure. Source: PIB – Floating Solar Park, Agrivoltaics |
| Ease of Doing RE | Centralized portals (like RE-Invest, National Single Window) speed up approvals and auctions. |
What Lies Ahead
India stands at a tipping point. We’ve built the foundation — now the challenge is scale, storage, and system redesign.
If India can resolve its grid bottlenecks, land hurdles, and policy friction, it has the potential not just to meet — but lead — the global clean energy transition.
Bold government schemes, massive investments, and a growing domestic manufacturing base show that India isn’t just reacting — it’s planning for a green future. But execution speed, state-level alignment, and technological breakthroughs will determine how fast we get there.
In Summary
India’s renewable energy transition isn’t just about adding megawatts — it’s about building the full ecosystem:
- From manufacturing to storage,
- From transmission to financing,
- From policy clarity to green fuels like hydrogen.
These bold moves show that while the 2070 Net Zero goal is ambitious, India is treating it like an infrastructure revolution — not just an energy shift.
Data Sources
| Source Category | Links |
|---|---|
| Installed Power Capacity | CEA Installed Capacity – June 2025 |
| Renewable Power Generation | CEA Executive Summary – May 2025 |
| Power Demand | CEA Power Supply Report – May 2025 |
| Fossil Power Generation – All | CEA Generation Reports Portal |
| – Coal & Lignite | Coal & Lignite Generation – May 2025 |
| – Gas & Liquid | Gas & Liquid Fuel Generation – May 2025 |
| – Diesel | Diesel Generation – May 2025 |
| Power Target – 2030 | India’s 2030 Target – 500 GW Non-Fossil (PIB, May 2024) |
Other Interesting Reads from Indiagraphs
- Why India Was Called the Golden Bird
- How Much Gold Does India Really Produce?
- Top Gold Reserve Holding Countries in 2025: Where Does India Stand
- India’s Gold Reserves (2000–2025): A Strategic Shift in National Wealth
- Should You Consider Gold in the Long Run? A 42-Year Data Story of Price & CAGR in India
- India’s Gold Obsession by the Numbers: 14 Years, ₹37 Lakh Crore, and a Swiss Surprise
- PAN Card Statistics 2025
- Gold Vs Sensex Returns
- India vs Dollar: 25 Years of Currency Change and Global Comparison