Gold vs Sensex: 25-Year Wealth Builder — What ₹1 Lakh Taught Us About Long-Term Wealth
If you had ₹1 lakh in 2000, where would you be richer today — in Gold or the Sensex?
Over the past 25 years, both assets have told a fascinating story of India’s growth, global shocks, and investor sentiment. One shines in crisis, the other compounds in calm. In this data story, we break down how Gold and Sensex performed between April 1, 2000 and March 31, 2025, and what this means for Indian investors, savers, and future planners.
Why This Comparison Matters
In India, gold is emotion, and the Sensex is evolution. Our data story on India’s Gold Obsession shows how deep this emotional and financial connection runs. Millions buy gold for weddings, festivals, or as a ‘safe’ investment. Others trust the Sensex (stock market index) to grow wealth. Comparing the two helps answer:
- What builds more wealth in the long run?
- Which is safer during uncertainty?
- Should you invest in both?
Let’s begin with the hard data.
25 Years of Data: Gold vs Sensex
| Financial Year | Sensex (31 Mar) | Avg Gold Price (₹/10g, 24K) |
| 2000–2001 | 3,604.38 | ₹4,473.60 |
| 2001–2002 | 3,469.35 | ₹4,579.12 |
| 2002–2003 | 3,048.72 | ₹5,332.36 |
| 2003–2004 | 5,590.60 | ₹5,718.95 |
| 2004–2005 | 6,492.82 | ₹6,145.38 |
| 2005–2006 | 11,279.96 | ₹6,900.56 |
| 2006–2007 | 13,072.10 | ₹9,240.32 |
| 2007–2008 | 15,644.44 | ₹9,995.62 |
| 2008–2009 | 9,708.50 | ₹12,889.74 |
| 2009–2010 | 17,527.77 | ₹15,756.09 |
| 2010–2011 | 19,445.22 | ₹19,227.08 |
| 2011–2012 | 17,404.20 | ₹25,722.42 |
| 2012–2013 | 18,835.77 | ₹30,163.93 |
| 2013–2014 | 22,386.27 | ₹29,190.39 |
| 2014–2015 | 27,957.49 | ₹27,414.55 |
| 2015–2016 | 25,341.86 | ₹26,534.26 |
| 2016–2017 | 29,620.50 | ₹29,665.28 |
| 2017–2018 | 32,968.68 | ₹29,300.08 |
| 2018–2019 | 38,672.91 | ₹31,193.41 |
| 2019–2020 | 29,468.49 | ₹37,017.91 |
| 2020–2021 | 49,509.15 | ₹48,723.22 |
| 2021–2022 | 58,568.51 | ₹47,999.25 |
| 2022–2023 | 58,991.52 | ₹52,730.77 |
| 2023–2024 | 73,651.35 | ₹60,623.95 |
| 2024–2025 | 77,414.92 | ₹91,910.00 |
Source: BSE, RBI, GoodReturns
CAGR and final wealth based on initial investment on April 1, 2000
The Investment Thought Experiment: ₹1 Lakh in April 2000
Let’s assume you had ₹1 lakh to invest on April 1, 2000 — either in gold (24K, 10g) or directly into the BSE Sensex.
Here’s how your wealth would’ve grown over the next 25 years.
Final Wealth on March 31, 2025:
| Asset | Final Value (₹) | Absolute Return | CAGR (25 Years) |
| Gold | ₹20.54 lakh | 1,954% | 12.85% |
| Sensex | ₹21.48 lakh | 2,048% | 13.05% |
Outcome: While both assets delivered impressive long-term gains, Sensex outperformed Gold by just 0.2% CAGR — a difference that led to ₹94,000 more wealth on a ₹1 lakh investment.
Year-Wise Growth Comparison (2000-2025)
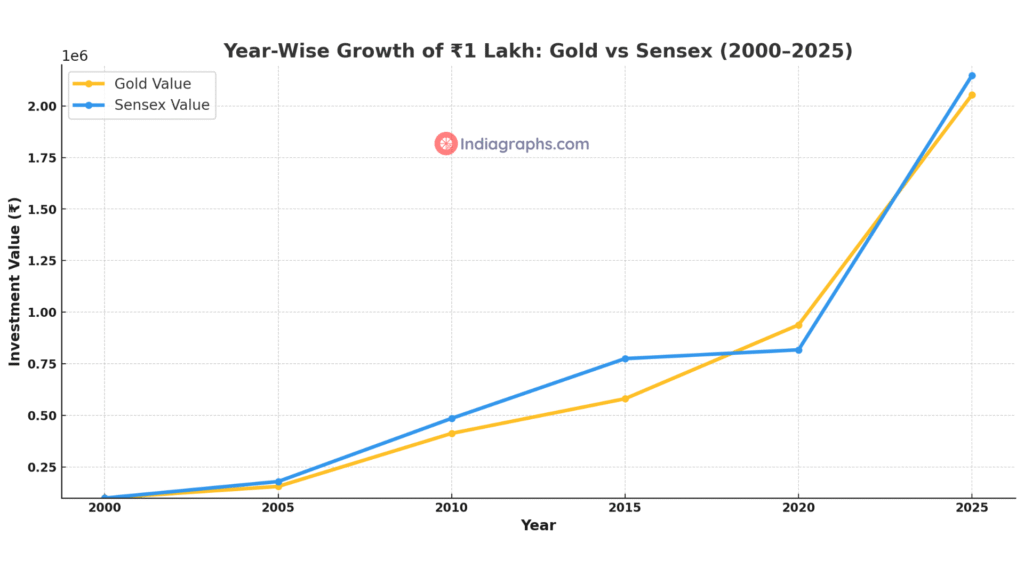
| Year | Gold Price (₹/10g) | Sensex Closing | Gold Value (₹1L) | Sensex Value (₹1L) |
| 2000 | ₹4,473.60 | 3,604.38 | ₹1,00,000 | ₹1,00,000 |
| 2005 | ₹7,000 | 6,492.82 | ₹1.56 lakh | ₹1.80 lakh |
| 2010 | ₹18,500 | 17,527.77 | ₹4.13 lakh | ₹4.86 lakh |
| 2015 | ₹26,000 | 27,957.49 | ₹5.81 lakh | ₹7.76 lakh |
| 2020 | ₹42,000 | 29,468.49 | ₹9.39 lakh | ₹8.18 lakh |
| 2025 | ₹91,910 | 77,414.92 | ₹20.54 lakh | ₹21.48 lakh |
Observation: Between 2011 and 2020, gold outperformed Sensex, acting as a safety net during turbulent times. But post-2020, equities rebounded strongly, allowing the Sensex to overtake gold and finish slightly ahead.
If you had invested ₹1 lakh in Gold or the Sensex in 2000, here’s how your wealth would have grown by 2025.
This visual shows how both assets performed over time, highlighting periods of crisis, recovery, and long-term compounding.
When Did Each Asset Win?
2003–2008: Bull Run
Sensex soared on the back of rapid infrastructure growth, foreign institutional inflows, and tech momentum. Gold rose too, but equities outpaced it significantly.
2008–2012: Crisis & Euro Zone Woes
Global financial crisis crushed equity markets — Sensex halved in 2008. Gold became the go-to safe haven, delivering stellar returns and shielding investors.
2014–2019: Political Stability & Reforms
Equities gained from economic reforms like GST, FDI liberalization, Make in India, and growing digitalization. Gold underperformed as inflation was subdued.
2020–2021: COVID Shock & Liquidity Boom
Gold spiked amid global panic, hitting ₹50,000+. But equities made a comeback by late 2020 due to global liquidity, tech-led rally, and vaccine optimism.
2022–2025: Inflation, Rate Hikes & Resilience
Gold performed well as inflation and geopolitical uncertainty lingered. Sensex, however, surged on the strength of India’s economic growth, IPOs, and digital transformation.
The Analogy: Mango Tree vs Bamboo
Gold is like a mango tree — it grows slowly, yields regularly, and offers consistent shade during tough seasons. You may not get explosive growth, but it provides emotional comfort and crisis-time reliability.
Sensex (equities) is more like bamboo — you may not see much growth initially, but once it takes off, it shoots upward rapidly, rewarding those who stayed patient during its silent phase. Both have their role. One gives security, the other scalability.
Why This Matters: Beyond Returns
Investing isn’t just math — it’s emotion, risk tolerance, and timing.
- Gold is a historical favorite in Indian households — especially among rural savers, women, and retirees. It offers:
- Safety from inflation and currency devaluation
- Hedge during geopolitical crises
- Liquidity in emergencies
- Sensex represents the growth of India Inc. It reflects:
- Expanding corporate earnings
- Economic growth and innovation
- Compounding power when held for decades
Volatility & Investor Psychology
| Asset | Volatility | Emotional Impact |
| Gold | Low-Mid | Trusted in uncertain times |
| Sensex | High | Fear during market crashes |
Key Takeaways for Investors
- Start early, stay long: Compounding needs time. 25 years turned ₹1 lakh into over ₹20 lakh — for both assets.
- Diversify smartly: Gold protects. Equity grows. Keep both — like shock absorbers and engine.
- Ignore short-term noise: Between 2011 and 2020, gold led. Post-2020, equity jumped. Chasing short-term winners hurts in the long run.
- CAGR difference matters: A 0.2% higher CAGR in equity created nearly ₹1 lakh more. Over longer periods, even 1% matters a lot.
- Match assets to life stages: Gold may suit those near retirement or risk-averse. Equities may suit young earners seeking growth.
Final Word: It’s Not Gold vs Equity — It’s Gold and Equity
There’s no one-size-fits-all answer.
But this 25-year journey proves one thing: Patience pays. Whether you plant mango or bamboo, stay the course, and wealth will grow.
In a world chasing quick returns, the real wealth builders — like gold and Sensex — remind us that time in the market beats timing the market.
Data Sources Used in the Blog
- BSE India – For historical Sensex closing values as of 31st March each year.
- RBI (Reserve Bank of India) – For average annual gold prices (24K per 10g) in India.
- GoodReturns.in – For gold price on 31st March 2025
- Internal Calculations (Indiagraphs) –To compute CAGR, final values of ₹1 lakh investment, and year-wise wealth comparisons.
Related Reads from Indiagraphs
- Sensex vs INR: 25 Years of Currency and Equity
How rupee depreciation affected Sensex wealth. - Why India Was Called the Golden Bird
The cultural and historical roots of India’s gold legacy. - Gold Price History: 42 Years of RBI Data
Visual charts and annual trends since 1983.
About Indiagraphs Insights
This article is written by the Indiagraphs editorial team — experts in decoding India’s data through charts, maps, and intelligent commentary. Learn more about us here.