Sensex Returns vs INR Depreciation: 25 Years of Market Growth vs Currency Erosion
Two Indicators, One Nation’s Economic Journey
Over the last 25 years, two financial indicators have silently shaped the wealth of millions of Indians: the Sensex, India’s benchmark stock market index, and the INR/USD exchange rate, a reflection of our currency’s strength on the global stage.
At first glance, they seem unrelated – one tracks the stock market, the other, currency. But when you look at them side by side over a quarter-century, an interesting story unfolds.
Let’s explore how both have moved over the years, how a weakening rupee has influenced market growth, and what investors can learn as they plan for the next 10 years.
The Data: 25 Years of Sensex and INR/USD on 31st March Each Year
| Financial Year | Sensex (31 Mar) | INR/USD (31 Mar) |
| 2000-2001 | 3604.38 | 46.64 |
| 2001-2002 | 3469.35 | 48.80 |
| 2002-2003 | 3048.72 | 47.51 |
| 2003-2004 | 5590.6 | 43.45 |
| 2004-2005 | 6492.82 | 43.76 |
| 2005-2006 | 11279.96 | 44.61 |
| 2006-2007 | 13072.1 | 43.60 |
| 2007-2008 | 15644.44 | 39.99 |
| 2008-2009 | 9708.5 | 50.95 |
| 2009-2010 | 17527.77 | 45.14 |
| 2010-2011 | 19445.22 | 44.65 |
| 2011-2012 | 17404.2 | 51.16 |
| 2012-2013 | 18835.77 | 54.39 |
| 2013-2014 | 22386.27 | 60.10 |
| 2014-2015 | 27957.49 | 61.14 |
| 2015-2016 | 25341.86 | 65.47 |
| 2016-2017 | 29620.5 | 67.07 |
| 2017-2018 | 32968.68 | 64.45 |
| 2018-2019 | 38672.91 | 69.92 |
| 2019-2020 | 29468.49 | 70.90 |
| 2020-2021 | 49509.15 | 74.23 |
| 2021-2022 | 58568.51 | 74.50 |
| 2022-2023 | 58991.52 | 80.36 |
| 2023-2024 | 73651.35 | 82.79 |
| 2024-2025 | 77414.92 | 85.43 |
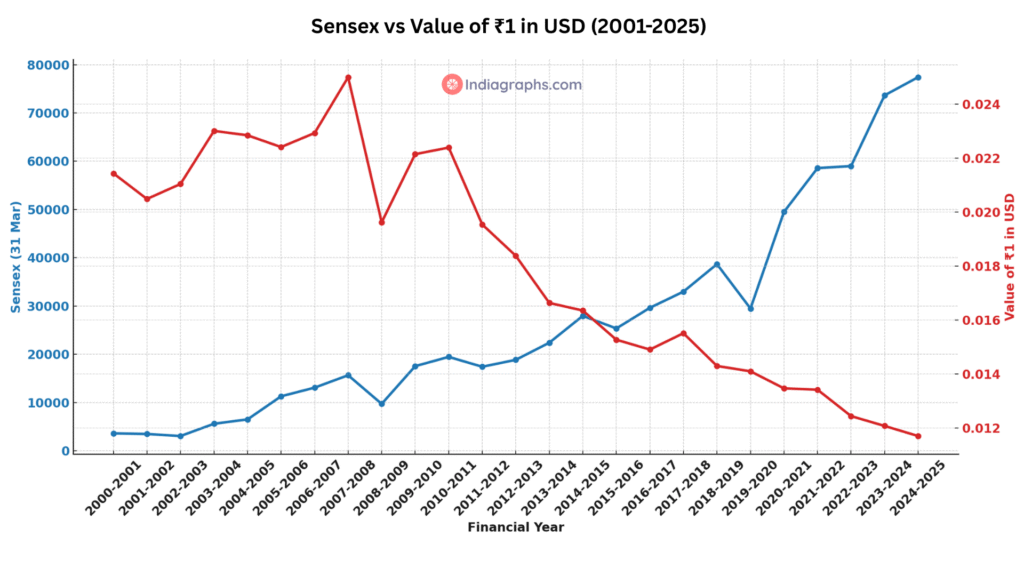
India’s stock market soared, but the rupee silently slipped.
While Sensex delivered massive growth for Indian investors, the weakening rupee quietly trimmed the gains for global investors.
The chart below shows how ₹1 has lost value in USD terms, even as Sensex kept climbing.
What If You Had Invested ₹1 Lakh in 2000?
Let’s assume you invested ₹1 lakh in the Sensex on 1st April 2000.
- Value on 31st March 2025:
₹1,00,000 would have grown to approximately ₹21.46 lakh. - CAGR (Compound Annual Growth Rate):
13.05% per year – completely passive, no timing, just index growth.
Verified CAGR Calculation
CAGR = [(Ending Value / Beginning Value) ^ (1 / Number of Years)] – 1
CAGR = (77,414.92 / 3,604.38)^(1 / 25) – 1
CAGR = (21.48)^(1/25) – 1
CAGR = 13.05%
This highlights the power of long-term investing – staying invested in the Indian market without trying to predict highs and lows could’ve delivered 21x returns.
What Happened to the Rupee in These 25 Years?
- INR depreciated from ₹46.64 (March 2001) to ₹85.43 (March 2025).
- This means the rupee lost nearly 83% of its value against the US dollar.
Annual depreciation: Around 2.6% per year.
Comparing Both Journeys: Market vs. Currency
| Metric | 2000-01 | 2024-25 | CAGR |
| Sensex | 3,604.38 | 77,414.92 | 13.63% |
| INR/USD | ₹46.64 | ₹85.43 | –2.55% |
So while the Sensex grew nearly 21.5x, the rupee halved in strength vs. the dollar.
Why Did Sensex Grow Despite INR Weakening?
- Many top Sensex companies earn significant global revenue (Infosys, TCS, Reliance, etc.)
- India’s domestic consumption story has remained strong
- Investors tend to hedge inflation and currency risks by investing in equities
So while your rupee may be weaker in the FX market, your investment power can grow faster through equities – if you stay long-term.
Who Gains and Who Loses When Rupee Weakens?
Winners
- Indian Long-Term Equity Investors
- Depreciation does not impact INR-based returns.
- ₹1 lakh turned to ₹21.5 lakh over 25 years.
- Export-Oriented Businesses (IT, Pharma, Textiles)
- Earnings come in USD, expenses in INR.
- Currency depreciation boosts profitability.
Losers
- Foreign Portfolio Investors (FPIs)
- Returns get reduced when converting INR → USD.
- E.g., 13.6% INR CAGR minus 2.5% rupee depreciation → ~10.6% USD CAGR.
- This currency risk affects FPI inflows and USD-based fund strategies.
- Import-Heavy Sectors (Oil, Aviation, Electronics)
- Rising import costs due to weak rupee.
- Reduced margins or passed-on costs to consumers → inflation.
If You Were a US Investor..
Let’s say an American invested $1,000 in Sensex in 2000.
- $1,000 = ₹46,640 in 2000
- Grew 21.48x → ₹10.02 lakh in 2025
- But now INR/USD is ₹85.43 → $10.02 lakh = $11,730
- Net gain = 11.73x = CAGR ~10.84% in USD terms
Takeaway: Annual rupee depreciation (~2.5%) compounded to erode ~3% of returns for USD investors.
The Next 10 Years – What Might Happen?
Let’s assume:
- Sensex grows at 13.5% CAGR (as before)
- INR depreciates at 2.5% per year
Projection (₹1 lakh invested in 2025)
| Year | Value (₹) | INR/USD | USD Value |
| 2025 | ₹1,00,000 | ₹85.43 | $1,171 |
| 2035 | ₹3,53,000 | ₹109.60 | $3,220 |
- For Indian investors: CAGR = 13.5%, ₹1L → ~₹3.53L
- For US investors: CAGR ≈ 10.5%, $1,171 → ~$3,220
So, a consistent 2.5% annual rupee depreciation compounds to a ~22% drop over a decade — effectively eroding 20–25% of foreign investors’ returns, unless FX risk is hedged (which comes with a cost).
For example, if a US investor earns 100% returns in INR terms (i.e., doubles their money in India), they’d only get around 75–80% returns in USD, after accounting for rupee depreciation over those 10 years.
Final Insights: What This Means for You
For Indian Investors:
- Focus on long-term equity investing.
- Currency depreciation is not a problem if your liabilities and life are in INR.
- Sensex shows robust historical compounding.
For Global Investors:
- India offers solid growth, but FX risk matters.
- INR depreciation can shrink your real gains.
- Options:
- Hedge your currency risk (costs ~1–2%/year)
- Diversify exposure across currencies
For Businesses:
- Exporters: Rupee fall = bonus
- Importers: Rupee fall = inflation and margin pressure
Investors should choose sectors aligned with currency trends
Conclusion: A Tale of Two Curves
The Sensex soared 21x in 25 years. The rupee halved.
This dual journey teaches us:
- Indian equities reward long-term believers.
- Currency depreciation is slow but impactful, especially for global capital.
- Investors must understand the difference between nominal returns and real, FX-adjusted wealth.
Sources
- INR/USD (FY-end values): Reserve Bank of India. Handbook of Statistics on the Indian Economy 2023-24 (Table 139).
- INR/USD for FY 2024-25: Federal Reserve Board. Historical Exchange Rates – Indian Rupee per 1 USD.
- Sensex (Closing values on 31 March each year): BSE India. Index Archive Data – S&P BSE Sensex.
All values have been carefully compiled and cross-verified. However, in case of any discrepancy or update in source data, please feel free to reach out or revalidate using the links provided.
You may also like
- India’s Rupee vs US Dollar: 25-Year Timeline
- PAN Card Statistics 2025: Gender & Age Breakdown
- India’s Gold Obsession: ₹37 Lakh Crore Spent in 14 Years
- Should You Consider Gold in the Long Run?
- Why India Was Called the Golden Bird
About Indiagraphs Insights
Indiagraphs is a data storytelling platform focused on decoding India’s economy, policy, and people – one graph at a time.

